
2D Plots - Fancy Graphic Tool
Matlab includes
fancy tools for visualization. Basic 2D plots, good 3D
graphics, and even animation possibilities are available
in an easy environment.
The most basic and useful command for producing simple 2D plots is: plot( xvalues, yvalues, ' style')
Examples:
You may annotate your plots with ' xlabel', ' ylabel' and ' title'. Other useful functions are ' legend', ' axis', ' grid' and ' hold'. Here's an example that integrates all of the above functions. % Clears variables, command window, and closes all figures clear, clc,close all % Defines value of x and two functions x = 0: .1 : 2*pi; y1 = cos(x); y2 = sin(x); % Plots two functions with different style, and wider lines plot(x,y1,'b', x, y2, 'r-.', 'linewidth', 2) % Activates the grid grid on % Defines limits for x and y axes, and sets title, labels and legends axis([0 2*pi -1.5 1.5]) title('2D plots', 'fontsize', 12) xlabel('angle') ylabel('f1(x), f2(x)') legend('cos(x)', 'sin(x)') % Keeps figure on screen, in order to add a third function hold on % Defines another function y3 = 0.5 * x; % Plots over the previous figure plot(x, y3, 'm') And the result is: 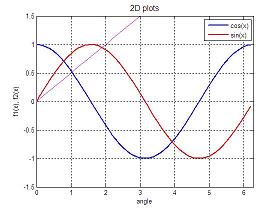
Next: Pie Plots Video: changing x-label ticks From '2D plots' to home From '2D plots' to 'Matlab Plots' Top |
undefined undefined undefined undefined undefined undefined undefined undefined undefined undefined undefined undefined undefined undefined undefined undefined |
undefined
