
Comet Plot comet(a, b) displays an animated comet plot of vector b vs. a. comet(a, b, p) uses a comet of length p*length(b). Default is p = 0.10. Example: If you want to plot the following function:  ,
for the range ,
for the range  ,
you can write this script
in Matlab: ,
you can write this script
in Matlab:% Clears variables, command window, and closes all figures clc; clear; close all % Generates 300 linearly spaced points from 0 to 8*pi x = linspace(0, 8*pi, 300); % Creates the formula to be plotted % (it's a multiplication between vector 'x' and vector 'cos(x)') y = x .* cos(x); % Plot it! comet(x, y, .6) An the result is... 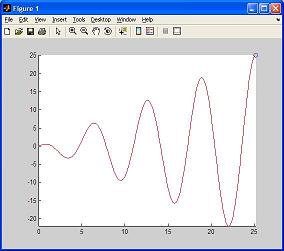 It is much better to see it on your own screen, because it moves like a ribbon! You can experiment with different p values to see the length of the comet changing... From 'Comet Plot' to home From 'Comet Plot' to 'Matlab Plots'
|
