
hist - Histograms in MatlabCommands for histograms and vertical dataThe hist instruction in Matlab, without output arguments, produces a histogram bar plot of the results.The bar edges on the first and last bins may extend to cover the min and max of the data unless a matrix of data is supplied. A histogram is a graphical representation used to estimate the probability distribution of a variable. It counts the frequencies of data into discrete intervals (bins), and then plots a rectangle over each interval. Example 1: This Matlab code creates a histogram with 3 bars. The first bar has two '1' values, the second bar has three '2' values, and the third bar has one '3' values. y = [1 1 2 2 2 3] hist(y) 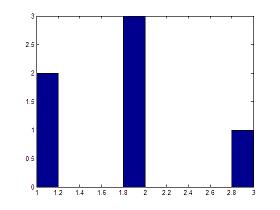 The vertical axis has the number of those values in the vector. Example 2: This Matlab code generates a histogram of 15 randomly distributed numbers between 0 and 1 (you can type 'help rand' on your command window to learn about random numbers). a = randn(15,1) hist(a) a = -0.8468 -0.2463 0.6630 -0.8542 -1.2013 -0.1199 -0.0653 0.4853 -0.5955 -0.1497 -0.4348 -0.0793 1.5352 -0.6065 -1.3474 >> 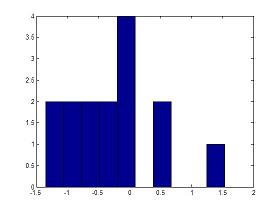 You can type ' help hist ' or ' help bar ' on your command window to see more details of use. Plot Simple Animation - Comet Video: interactively create plots Video: changing ticks along x-axis From 'hist' to home From 'hist' to 'Matlab Plots' Top
|

