

loglog - logarithmic plotIn this example we are going to demonstrate how to use the 'loglog' function included in Matlab to produce non-linear plots. This term refers to the fact that the plot is logarithmically scaled in both axes. There are other functions such as 'semilogx' and 'semilogy' which have one axis in linear scale and the other axis in logarithmic scale. 1.- Create a plot using a logarithmic scale for both the x-axis and the y-axis (loglog):clear;
clc; close all %
Define your independent variable %
Define values along your x-axis %
Plot your function with a wider line and grid the figure %
Use a title for the figure %
Label your x-axis with a double line. %
Label your y-axis The produced figure is:  2.- Create a plot with a logarithmic scale for the x-axis and a linear scale for the y-axis (semilogx):% clear memory data and command windowclear; clc; close all % define your linear data x = 0 : 1000; % define your logarithmic function y = log(x); % plot your log function on linear data semilogx(x, y) % define values of axes and grid axis([1 1000 0 7]) grid % add relevant info title('Example of Semilogx') xlabel('x') ylabel('y = log(x)') The resulting figure is  3.- Create a plot with a logarithmic scale for the y-axis and a linear scale for the x-axis (semilogy):clear; clc; close all% now your data along the x-axis is linear x = 0 : 0.5 : 10; % your function is now exponential y = exp(x); % see the plot semilogy(x, y) plot % add info title('Example of Semilogy') xlabel('x') legend('y = e^x') The plot is 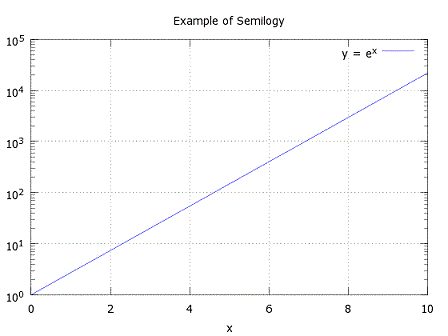 From 'loglog' to home From 'loglog' to '2D Plot Menu'
|
