logo for matrixlab-examples.com
[?] Subscribe To This Site

XML RSS
Add to Google
Add to My Yahoo!
Add to My MSN
Subscribe with Bloglines


Home
Welcome Matrixmania Blog
-> Sitemap / Search <-
-> Books <-
Forums and Help
Contact
Basics Quick Matlab Guide
Matlab Tutorial
Matlab Examples
Matlab Flow Control
Boolean Logic
Plots and GUI Matlab 2D Plots
Matlab 3D Plots
Matlab GUI
Applications Calculus
Linear Algebra
Matlab Cookbook I
Matlab Cookbook II
Electrical Calculations
Probability and Stats
Finance Apps
Other Relevant Links
Notes on Computing
Online Calculators
Fun!
Your own Website?
Terms/Policies
leftimage for matrixlab-examples.com

Matlab Plot - stem

In this example, we study the 'stem' instruction to plot Matlab functions.

It draws vertical lines (with a little circle at the tip) proportional to the value of the function at that particular horizontal value. 'stem' does not join the circles with a line, and it is very helpful to stress the fact that the function is not continuous but discrete.


Let's assume that we want to plot the following elegant exponential and sinusoidal function:
exponential function to demonstrate the use of Matlab plot stem


Example: let's draw a simple discrete function


We can develop a script like this:

% Avoid superimposed operations and close previous figs.
clc; clear; close all 

% First, we define 51 values of our independent variable
x = 0 : 2*pi/50 : 2*pi; 

% Second, we define the function to graph
y = exp(-x/3) .* sin(x); 

% Third, we use the 'stem' function to plot discrete values
stem(x,y) 

% We can add title and labels (as strings in arguments)
title('Demonstration of the -stem- function')
xlabel(
'angle x')
ylabel(
'f(x)')


And we get the following plot:

demonstration of Matlab plot 1 - stem function

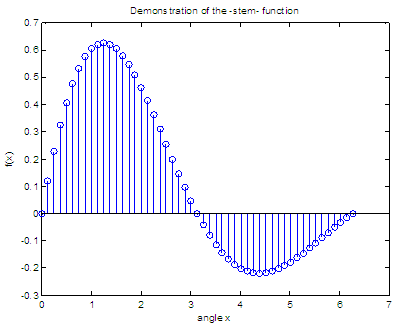
If we define our independant variable using less points, as in

x = 0 : 2*pi/20 : 2*pi;

we get the following visual change:

Graphs with Matlab - demo of stem function - 2


 From 'Matlab Plot' to home
 
 From 'Matlab Plot' to '2D Plot Menu'
 

Top

Horizontal and Vertical lines

Different 2D Graphs


footer for matlab plot page