

Tutorial Lesson: a Matlab Plot (creating and printing figures)
The video shows you the main idea. Below the video, you can see all the details of the code... In the command window, you first create a variable named 'angle' and assign 360 values, from 0 to 2*pi (the constant 'pi' is already defined in MATLAB): >> angle = linspace(0,2*pi,360); Now, create appropriate horizontal and vertical values for those angles: >> x=cos(angle); >> y=sin(angle); Then, draw those (x,y) created coordinates: >> plot(x,y) Set the scales of the two axes to be the same: >> axis('equal') Put a title on the figure: >> title('Pretty Circle') Label the x-axis and the y-axis with something explanatory: >> ylabel('y') >> xlabel('x') Gridding the plot is always optional but valuable: >> grid on You now see the figure: 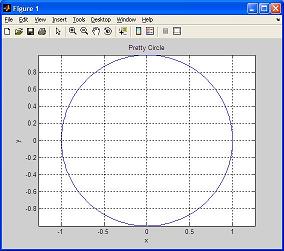 The 'print' command sends the current plot to the printer connected to your computer: The arguments of the axis, title, xlabel, and ylabel commands are text strings. Text strings are entered within single quotes ('). Do you like your plot? Interesting and funny, isn't it? From 'Matlab Plot' to home From 'Matlab Plot' to 'Matlab Tutorial' Table of Contents / Search |
