

Examples: MATLAB Plots
% Simple script to plot a cosine % vector x takes only 10 values x = linspace(0, 2*pi, 10); y = cos(x); plot(x,y) xlabel('x') ylabel('cos(x)') title('Plotting a cosine') grid on The result is: 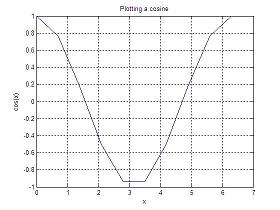 If we use 100 points rather than 10, and evaluate two cycles instead of one (like this): x = linspace(0, 4*pi, 100); We obtain a different curve: 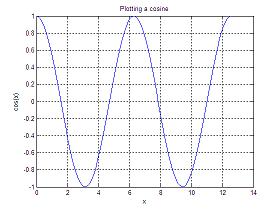 Now, a variation with line-syles and colors (type 'help plot' to see the options for line-types and colors): clear; clc; close all; % Simple script to plot a cosine % vector x takes only 10 values x = linspace(0, 4*pi, 100); y = cos(x); plot(x,y, 'ro') xlabel('x (radians)') ylabel('cos(x)') title('Plotting a cosine') grid on 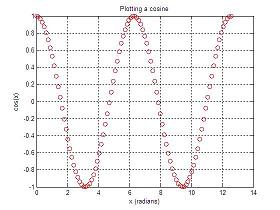 Space curve Use the command plot3(x,y,z) to plot the helix: If x(t)=sin(t), y(t)=cos(t), z(t)=(t) for every t in  , ,then, you can type this code in an 'm-file' or in the command window: % Another way to assign values to a vector t = 0 : pi/50 : 10*pi; plot3(sin(t),cos(t),t); 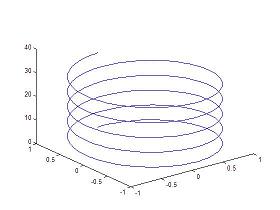 You can use the 'help plot3' command to find out more details. From 'Matlab Plots' to home From 'Matlab Plots' to 'Matlab Examples'
|

