

Pie Plots - figures in Matlabpie(x) draws pie plots of the data in the vector x. The values in x are normalized via x/sum(x) to determine the area of each slice of pie. If sum(x) is less or equal to 1, the values in x directly specify the area of the pie slices. Only a partial pie will be drawn if sum(x) is less than < 1. The '%' sign indicates that there is a comment in that line and Matlab does not do anything with it. It is as if it were inexistent, and it exists only for explanatory purposes. Example: % Clears variables, command window, and closes all figures clc; clear; close all % These are the names of the slices names = char('Region 1', 'Region 2', 'Distr. 3', 'Distr. 4'); % These are the numbers to be plotted data = [1200, 500, 300, 120]; pie(data) % gtext('string') displays the graph window, puts up a % cross-hair, and waits for a mouse button or keyboard % key to be pressed. for i=1:4 gtext(names(i,:)); end title('Sales', 'fontsize', 15) The result is: 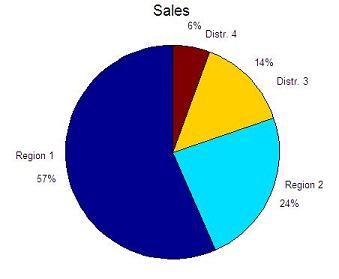 From 'Pie Plots' to home From 'Pie Plots' to 'Matlab Plots'
|
|||
