Resistor
Code with Matlab GUI
|
In this article we're going to decipher the
colored Resistor Code
with
a Matlab GUI.
The
intention
is to be able to use pull-down menus to decode the colors of four-band
resistors.
Colorbands
are commonly used (especially on resistors) because they are easily
printed on tiny components, decreasing manufacturing costs.
|
Download
files (right-click and save)
Use the following table and explanation to distinguish a color band's
value
and how to use it.
Black = 0
Brown = 1
Red = 2
Orange = 3
Yellow = 4 |
Green = 5
Blue = 6
Violet = 7
Gray = 8
White = 9 |
Gold =
+/-5%
Silver
= +/-10%
|
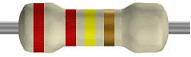
Find one of the four-band resistors. Hold the resistor with the gold or
silver band to the right. The first two bands from the left show the
value. If they are red and red, the value is 22. The third band shows
the number of zeros after the value. If it is yellow, then the number
of zeros is 4.
So the above resistor is 220000, or 220 K ohms (for easier reading).
The 'K' multiplier means 1,000 (kilo-ohms); the 'M' multiplier means
1,000,000 (mega-ohms).
The gold band indicates that the resistors are of 5% tolerance. A
silver band indicates a 10% tolerance.
An orange-red-brown-gold code equals a 320 +/-5% resistor.
Now with Matlab...
If this is your first GUI, I suggest you read these two initial
articles,
and then come-back and continue with this new project.
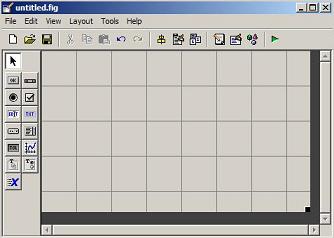
If you're ready, then type on the command window
>
guide
and a GUI window appears. Choose 'Blank GUI' and you'll get something
like this figure:
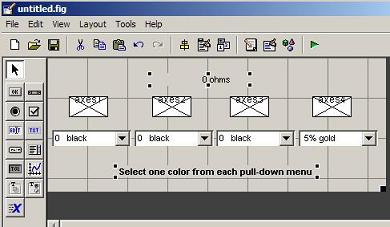
Use the buttons on the left to drag-and-drop 4 'pop-up' menus, 4
'axes', and 3 'static-text' boxes.
'Static-text1'
is used to give the message below the menus. It's 'String' property is 'Select one color from each
pull-down menu'. You can make it a bold font (double-click
on each menu and choose the different properties).
'Static-text2'
is used to display the resistor value. It starts with a '0' (zero) in its
string property. 'Static-text3'
just displays the word 'ohms'.
Arrange the elements and change their properties to achieve
something like this:
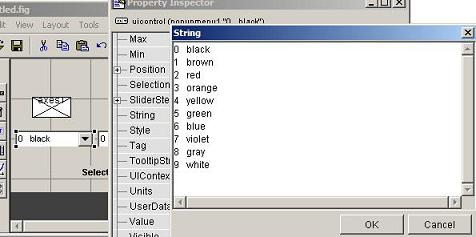
Include these values in the 'String' property of the first 3
pop-up menus
(double-click on each menu and choose the 'String' property):
For the 4th menu, you have to write ' 5% gold' and '10% silver' in its
'String' property.
Save the figure as resistor_code.fig. A template code is automatically
created with the name 'resitor_code.m'. We're going to modify it and
we're going to create other functions to make it work...
We'll create some Matlab functions and then we'll link them to this
initial template.
First, a function to initialize the GUI axes. I suggest the following
code:
% Initialize resistor code (bands)
% Show 0 ohm +/- 5%
function
init_bands(handles)
axes(handles.axes1);
image(imread('black.jpg'));
axis off;
axes(handles.axes2);
image(imread('black.jpg'));
axis off;
axes(handles.axes3);
image(imread('black.jpg'));
axis off;
axes(handles.axes4);
image(imread('gold.jpg'));
axis off;
This will display a 0-value with a 5% tolerance code in the GUI (colors
for the 4 bands are black - black - black - gold).
Now, to update the colors when the values are entered using the
pull-down menus, I suggest the following code:
function
update_color(ax, val, handles)
% Select the appropriate color to update
switch ax
case 1
axes(handles.axes1);
case 2
axes(handles.axes2);
case 3
axes(handles.axes3);
case 4
axes(handles.axes4);
end
% Choose the correct image to display
color = val(5 : length(val));
image(imread([color '.jpg']));
axis off;
The input parameters of this function are 'ax' (includes the correct
band number), 'val' (includes the selected option), and 'handles' (all
the handles to the objects in our created figure). We have to choose
the correct image to display. The name of the image is included in the
'val' parameter. You have to have .jpg images for each color.
Then, to update the total value of the resistor (values are entered
using the pull-down menus, too) I suggest the following code:
function
update_value(handles)
b = handles.b;
b_ttl = (b(1) + b(2)) * b(3);
if b_ttl < 1000
b_str
=
num2str(b_ttl);
end
% Format the number to make it more readable
% Consider to format only values >= 1000 k ohms
bs1 = num2str(b(1)/10);
bs2 = num2str(b(2));
switch b(3)
case 1e2
b_str =
[bs1 '.' bs2 ' K'];
case 1e3
b_str =
[bs1 bs2 ' K'];
case 1e4
b_str =
[bs1 bs2 '0 K'];
case 1e5
b_str =
[bs1 '.' bs2 ' M'];
case 1e6
b_str =
[bs1 bs2 ' M'];
case 1e7
b_str =
[bs1 bs2 '0 M'];
case 1e8
b_str =
[bs1 '.' bs2 ' G'];
case 1e9
b_str =
[bs1 bs2 ' G'];
end
% Actual display of the value in the 'static
text'
set(handles.text2, 'String', b_str);
This function reads the total value of the resistor bands and formats
it to make it more readable. It displays the number as a string, not as
a number, and adds appropriate multipliers (such as 'K' or 'M'). The
resulting string is displayed in 'Static-Text2'.
Please note that not all
the combinations are real standard resistor values.
This is a portion of the script that appears in the 'resistor_code.m'
file (the template created by Matlab). We have to fill in the necessary
code to achieve what we need.
Instructions contents = get(hObject,'String'), and
contents{get(hObject,'Value')} are the key Matlab
functions to read data from a pull down menu.
This code is for pop-up menu1. We read the menu, then we call our
previous function to update the color of the corresponding image, we
update the value of the resistor and finally save current data in the
handles. This has to be adapted for the other three menus and axes.
% - Executes on selection change in
popupmenu1.
function
popupmenu1_Callback(hObject, eventdata, handles)
% Hints:
% contents = get(hObject,'String') returns menu1
contents as
% cell array
% contents{get(hObject,'Value')} returns selected item
from
% menu1
contents = get(hObject,'String');
v = contents{get(hObject,'Value')};
% Update color of appropriate band
update_color(1, v, handles);
% Update resistor value
handles.b(1) = str2num(v(1)) * 10;
update_value(handles);
% Save data
guidata(hObject, handles);
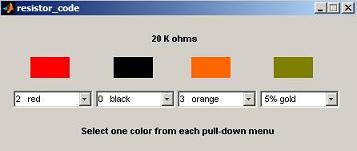
This is a
sample run:
The full code for the main routine is:
function varargout =
resistor_code(varargin)
% RESISTOR_CODE M-file for resistor_code.fig
%
% See also: GUIDE, GUIDATA, GUIHANDLES
% Last Modified by GUIDE v2.5 09-Jan-2010 19:48:33
% Begin initialization code - DO NOT EDIT
gui_Singleton = 1;
gui_State = struct('gui_Name',
mfilename, ...
'gui_Singleton', gui_Singleton,
...
'gui_OpeningFcn', @resistor_code_OpeningFcn, ...
'gui_OutputFcn', @resistor_code_OutputFcn,
...
'gui_LayoutFcn', []
, ...
'gui_Callback',
[]);
if nargin
&& ischar(varargin{1})
gui_State.gui_Callback
= str2func(varargin{1});
end
if nargout
[varargout{1:nargout}] =
gui_mainfcn(gui_State, varargin{:});
else
gui_mainfcn(gui_State,
varargin{:});
end
% End initialization code - DO NOT EDIT
% --- Executes just before resistor_code is
made
visible.
function
resistor_code_OpeningFcn(hObject, eventdata, handles, varargin)
% This function has no output args, see
OutputFcn.
% hObject
handle to figure
% handles
structure with handles and user data (see
GUIDATA)
% varargin
command line arguments to resistor_code (see
VARARGIN)
% Choose default command line output for
resistor_code
clc
handles.output = hObject;
% Initialize color of bands
init_bands(handles);
% Initialize and save resistor value
b(1) = 0;
b(2) = 0;
b(3) = 1;
handles.b = b;
% Update handles structure
guidata(hObject, handles);
% --- Outputs from this function are returned
to the
command line.
function varargout =
resistor_code_OutputFcn(hObject, eventdata, handles)
varargout{1} = handles.output;
% --- Executes on selection change in
popupmenu1.
function
popupmenu1_Callback(hObject, eventdata, handles)
% Hints:
% contents = get(hObject,'String') returns menu1
contents as cell array
% contents{get(hObject,'Value')} returns selected item
from menu1
contents = get(hObject,'String');
v = contents{get(hObject,'Value')};
% Update color of appropriate band
update_color(1, v, handles);
% Update resistor value
handles.b(1) = str2num(v(1)) * 10;
update_value(handles);
% Save data
guidata(hObject, handles);
% - Executes during object creation, after
setting
all properties.
function
popupmenu1_CreateFcn(hObject, eventdata, handles)
if ispc &&
isequal(get(hObject,'BackgroundColor'), ...
get(0,'defaultUicontrolBackgroundColor'))
set(hObject,'BackgroundColor','white');
end
% --- Executes on selection change in
popupmenu2.
function
popupmenu2_Callback(hObject, eventdata, handles)
% Hints:
% contents = get(hObject,'String') returns menu1
contents as cell array
% contents{get(hObject,'Value')} returns selected item
from menu1
contents = get(hObject,'String');
v = contents{get(hObject,'Value')};
% Update color of appropriate band
update_color(2, v, handles);
% Update resistor value
handles.b(2) = str2num(v(1));
update_value(handles);
% Save data
guidata(hObject, handles);
% --- Executes during object creation, after
setting
all properties.
function
popupmenu2_CreateFcn(hObject, eventdata, handles)
if ispc &&
isequal(get(hObject,'BackgroundColor'), ...
get(0,'defaultUicontrolBackgroundColor'))
set(hObject,'BackgroundColor','white');
end
% --- Executes on selection change in
popupmenu3.
function
popupmenu3_Callback(hObject, eventdata, handles)
% Hints:
% contents = get(hObject,'String') returns menu1
contents as cell array
% contents{get(hObject,'Value')} returns selected item
from menu1
contents = get(hObject,'String');
v = contents{get(hObject,'Value')};
% Update color of appropriate band
update_color(3, v, handles);
% Update resistor value
handles.b(3) = 10^(str2num(v(1)));
update_value(handles);
% Save data
guidata(hObject, handles);
% --- Executes during object creation, after
setting
all properties.
function
popupmenu3_CreateFcn(hObject, eventdata, handles)
if ispc &&
isequal(get(hObject,'BackgroundColor'), ...
get(0,'defaultUicontrolBackgroundColor'))
set(hObject,'BackgroundColor','white');
end
% --- Executes on selection change in
popupmenu4.
function
popupmenu4_Callback(hObject, eventdata, handles)
% Hints:
% contents = get(hObject,'String') returns menu1
contents as cell array
% contents{get(hObject,'Value')} returns selected item
from menu1
contents = get(hObject,'String');
% Update color of appropriate band
update_color(4, contents{get(hObject,'Value')}, handles);
% Save data
guidata(hObject, handles);
% --- Executes during object creation, after
setting
all properties.
function
popupmenu4_CreateFcn(hObject, eventdata, handles)
if ispc &&
isequal(get(hObject,'BackgroundColor'), ...
get(0,'defaultUicontrolBackgroundColor'))
set(hObject,'BackgroundColor','white');
end
Download
files (right-click and save)
From
'Resistor Code' to
home
From
'Resistor
Code' to 'Matlab GUI Menu'


|
|