

Scilab Piecewise FunctionIn Scilab programming, there’s a number of methods to achieve this kind of functions. We could use branches (if-else code), or different cases (switch-case code), and iterations (for or while-loops) in general. In this example, we’re going to use a vectorized approach... See Piecewise functions in Matlab First,
we have to understand some useful built-in functions or Scilab features
for
this task... When we
have a vector like this x
= -7
: 7 or x
= -7
-6 -5 -4 -3 -2 -1 0 1 2 3 4 5 6 7 we can
find a range of values and a range of indices for those values.
x2
=
x(-4 < x & x <= -3) is
going to generate a vector of x-values that meet the condition -4 < x <=
-3. Notice the particular syntax. The line uses a
conditional range (extraction
of values from a vector) including an ‘and’ operation (&). It
gives us the
x-values that meet both conditions -4 < x and x <= 3. For the
x-vector above, the result would be just one value x2
= -3 This
line find(-4
< x & x <= -3) is
going to generate a vector of indices of the values generated before. ans
= 5 because
5 is the index of the value -3 in the given vector x. Now,
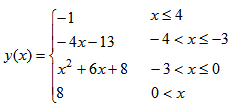
let’s say that we have a 4-piece function like this one:
We can
design a Scilab function to perform like that described one. It’s
called
piecewise3.sci and accepts a vector as input: function y = piecewise3(x) //
first piece - a constant //
second piece - a straight line //
third piece - a parabola //
fourth piece - another constant The general idea is to find the x-values for the different pieces of the function and then apply the corresponding formula just to those values. Finally, we have
to find the correct indices in the output vector to place those values.
We go
one piece at a time. In the first and fourth pieces above, we don’t
need to
find the x-values, because the function is a constant. We just have to
find the
indices where the constants are going to be placed. We can
call the code from our main script or from any other sci-file, like
this: //
Reset the environment //
declare the function to be called //
define your independent values in a column row //
call
your previously defined function //
plot The
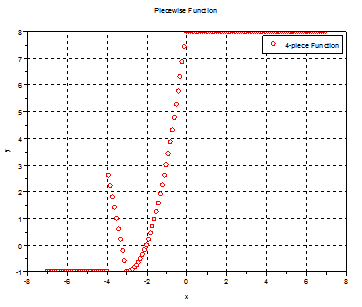
resulting plot is this:
|
From 'Scilab Piecewise Function' to Matlab home
From 'Scilab Piecewise Function' to Scilab Examples
| Top |
