T-statistic
Student’s
t-distribution Test
This
program performs the t-statistic and degrees of freedom for Student’s
distribution, in Matlab code. The calculations can be based on any one
of these three
hypotheses.
The
first hypothesis assumes that one population
mean is equal to a given
value.
You must enter the elements of the sample and the value of the mean.
The other
hypotheses compare two
samples. In both tests the means of the two
populations
are equal, but the standard deviations may be equal or different. For
these
hypotheses you must enter the elements of each sample.
We are
going to implement the following formulas:
First
case: one sample given, one mean assumed

where:
t = t-statistic result
df = degrees of freedom
v = sum of elements
d = sum of squared elements
r = number of elements in
sample
m = mean of current sample
gm = assummed mean
This is
how we can implement the formulas in Matlab:
function [t, df]
= t_test1(gv, gm)
%
Inputs: gv = given vector
%
gm = assumed mean
%
Outputs: t = t-test
%
df = degrees of freedom
%
number of elements in vector
r =
length(gv);
%
sum of elements
v =
sum(gv);
%
sum of squared elements
d =
sum(gv.^2);
%
mean of current vector
m =
mean(gv);
%
calculation of t-test and degrees of freedom
%
Case 1: one vector with assumed mean
av
= (d
- v^2 / r) / (r - 1);
t = (m -
gm) * sqrt(r/av);
df = r -
1;
Second
case: two samples given with equal mean and std. deviation
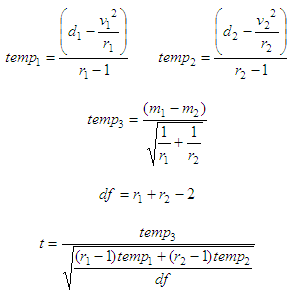
where:
t = t-statistic result
df = degrees of freedom
v1,2 = sum of elements in samples
1 and 2
d1,2 = sum of squared elements in
samples 1 and 2
r1,2 = number of elements in
samples 1 and 2
m1,2 = mean of samples 1 and 2
This is how we can
implement the second case in Matlab:
function [t, df]
= t_test2(gv1, gv2)
%
Inputs: gv1 = given sample 1
%
gv2 = given sample 2
%
Outputs: t = t-test
%
df = degrees of freedom
%
number of elements in vector 1
r1 =
length(gv1);
%
sum of elements in vector 1
v1 =
sum(gv1);
%
sum of squared elements in vector 1
d1 =
sum(gv1.^2);
%
mean of vector 1
m1 =
mean(gv1);
%
number of elements in vector 2
r2 =
length(gv2);
%
sum of elements in vector 2
v2 =
sum(gv2);
%
sum of squared elements in vector 2
d2 =
sum(gv2.^2);
%
mean of vector 2
m2 =
mean(gv2);
%
calculation of t-test and degrees of freedom
%
Case 2: two samples, equal mean and std. dev.
av1 =
(d1 - v1^2 / r1) /(r1 - 1);
av2 =
(d2 - v2^2 / r2) /(r2 - 1);
av3 =
(m1 - m2) / sqrt(1/r1 + 1/r2);
df = r1
+ r2 - 2;
t = av3
/ sqrt(((r1-1)*av1 + (r2-1)*av2) / df);
Third
case: two samples given with equal mean but different std. deviation
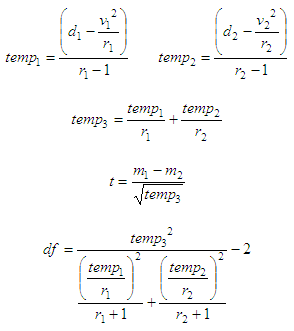
again:
t = t-test result
df = degrees of freedom
v1,2 = sum of elements in samples
1 and 2
d1,2 = sum of squared elements in
samples 1 and 2
r1,2 = number of elements in
samples 1 and 2
m1,2 = mean of samples 1 and 2
This is
our third case in Matlab code:
function [t, df]
= t_test3(gv1, gv2)
%
Inputs: gv = given vector
%
gm = assumed mean
%
Outputs: t = t-test
%
df = degrees of freedom
r1 =
length(gv1);
v1 =
sum(gv1);
d1 =
sum(gv1.^2);
m1 =
mean(gv1);
r2 =
length(gv2);
v2 =
sum(gv2);
d2 =
sum(gv2.^2);
m2 =
mean(gv2);
%
calculation of t-test and degrees of freedom
%
Case 3: two samples, equal mean but different std. dev.
av1
=
(d1 - v1^2 / r1) /(r1 - 1);
av2 =
(d2 - v2^2 / r2) /(r2 - 1);
av3 =
av1/r1 + av2/r2;
t = (m1
- m2) / sqrt(av3);
df =
round(av3^2/((av1/r1)^2/(r1+1) + (av2/r2)^2/(r2+1)) - 2);
Examples:
A sample of children’s IQs
was
taken, the result being 101,
99, 120, 79, 111, 98, 106, 112, 87, and 97.
Calculate the t-statistic assuming the population mean is 100.
A second sample was taken,
with
a result of 101,
95, 130, 150, 75, 79, 111, 100, 98, and 91. Calculate the
t-statistic based on the hypothesis that the two samples have equal
means and
standard deviations. Calculate again supposing that the std. deviation
is
different between the groups.
We can
create a wrapper for the three functions above. This wrapper is useful
to try
and drive our code.
clc;
clear; close all; format compact
v1 =
[101 99 120 79 111 98 106 112 87 97];
m = 100;
[t, df]
= t_test1(v1, m)
v2 =
[101 95 130 150 75 79 111 100 98 91];
[t, df]
= t_test2(v1, v2)
[t, df]
= t_test3(v1, v2)
The result for the first
case is:
t = 0.2615
df = 9
The
result for the second
case is:
t = -0.2465
df = 18
The result for the third
case is:
t = -0.2465
df = 15
From 'T statistic' to home
From
'T statistic' to 'Probability and Statistics Menu'


|

