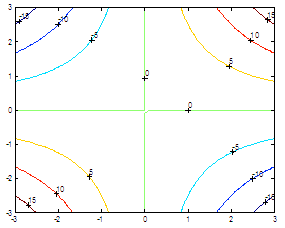

2D drawing – plots and graphs in Matlab
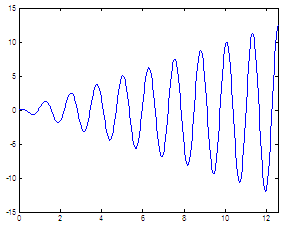
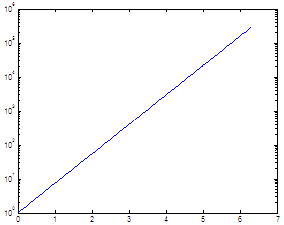
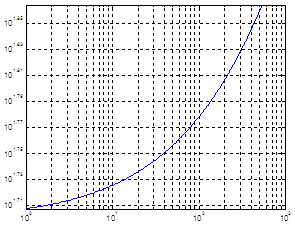
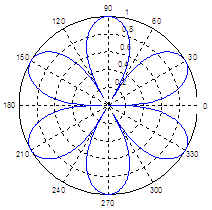
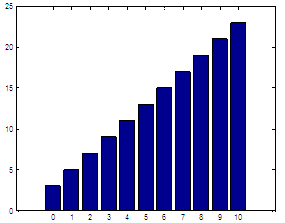
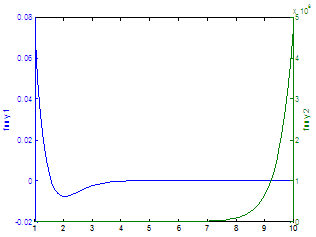
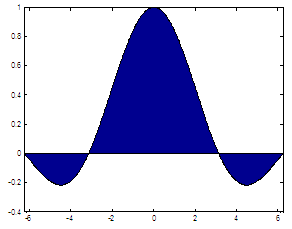
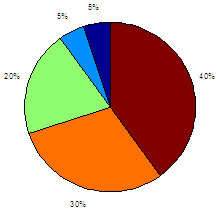
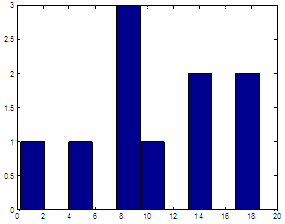
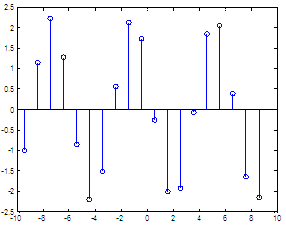
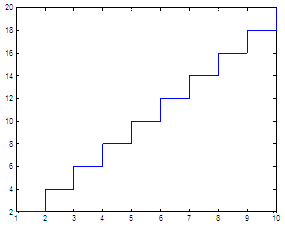
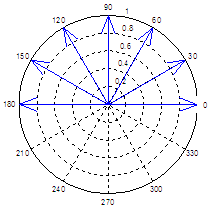
Below you can find examples of some 2D drawing functions. Many of them take optional arguments. These are just some ideas to give you basic understanding or how to use these built-in functions and what to expect from them. For more information, see the online Matlab help (type ‘ help function’ on your command window or see the Help menu).
|
undefined undefined undefined undefined undefined undefined undefined undefined undefined undefined undefined undefined undefined undefined undefined undefined undefined undefined undefined undefined undefined undefined undefined undefined undefined undefined undefined undefined undefined undefined undefined undefined undefined undefined undefined undefined undefined undefined undefined undefined undefined undefined undefined undefined undefined undefined undefined undefined undefined undefined undefined undefined undefined undefined undefined undefined undefined undefined undefined undefined undefined undefined undefined undefined undefined undefined undefined undefined undefined undefined undefined undefined undefined undefined undefined undefined undefined undefined undefined undefined undefined undefined undefined undefined undefined undefined undefined undefined undefined undefined undefined undefined undefined undefined undefined undefined undefined undefined undefined undefined undefined undefined undefined undefined undefined undefined undefined undefined undefined undefined undefined undefined undefined undefined undefined undefined undefined undefined undefined undefined undefined undefined undefined undefined undefined undefined undefined undefined undefined undefined undefined undefined undefined undefined undefined undefined undefined undefined undefined undefined undefined undefined undefined undefined undefined undefined undefined undefined undefined undefined undefined undefined undefined undefined undefined undefined undefined undefined undefined undefined undefined undefined undefined undefined undefined undefined undefined undefined undefined undefined undefined undefinedundefined undefined undefined |
