

3D graphs - plots and volumes in Matlab
Three-dimensional plots (or 3D graphs) can be created by this numerical software. Typing ‘ help graph3d’ in the command window gives a list of functions available for general 3D graphs.
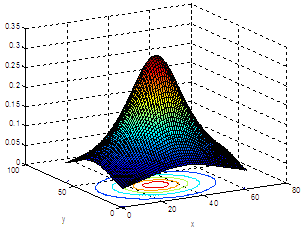
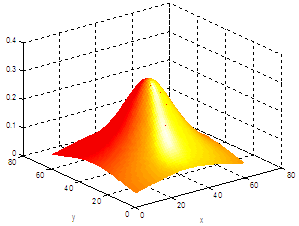
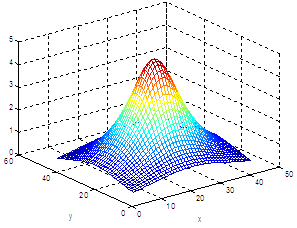
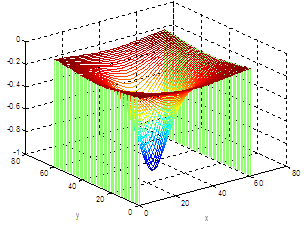
This is a kind of ‘catalog’ of the most popular 3D graphics functions. You can use these instructions for your needs simply by following the examples. The ‘ meshgrid’ function must be first understood.
|


undefined
undefined
undefined
undefined
undefined
undefined
undefined
undefined
undefined
undefined
undefined
undefined
undefined
undefined
undefined
undefined
undefined
undefined
undefined
undefined
undefined
undefined
undefined
undefined
undefined
undefined
undefined
undefined
undefined
undefined
undefined
undefined
undefined
undefined
undefined
undefined
undefined
undefined
undefined
undefined
undefined
undefined
undefined
undefined
undefined
undefined
undefined
undefined
undefined
undefined
undefined
undefined
undefined
undefined
undefined
undefined
undefined
undefined
undefined
undefined
undefined
undefined
undefined
undefined
undefined
undefined
undefined
undefined
undefined
undefined
undefined
undefined
undefined
undefined
undefined
undefined
undefined
undefined
undefined
undefined
undefined
undefined
undefined
undefined
undefined
undefined
undefined
undefined
undefined
undefined
undefined
undefined
undefined
undefined
undefined
undefined
undefined
undefined
undefined
undefined
undefined
undefined
undefined
undefined
undefined
undefined
undefined
undefined
undefined
undefined
undefined
undefined
undefined
undefined
undefined
undefined
undefined
undefined
undefined
undefined
undefined
undefined
undefined
undefined
undefined
undefined
undefined
undefined
undefined
undefined
undefined
undefined
undefined
undefined
undefined
undefined
undefined
undefined
undefined
undefined
undefined
undefined
undefined
undefined
undefined
undefined
undefined
undefined
undefined
undefined
undefined
undefined
undefined
undefined
undefined
undefined
undefined
undefined
undefined
undefined
undefined
undefined
undefined
undefined
undefined
undefined
undefined
undefined
undefined
undefined
undefined
undefined
undefined
undefined
undefined
undefined
undefined
undefined
undefined
undefined
undefined
undefined
undefined
undefined
undefined undefined undefinedundefined undefined undefined