Complex Numbers
A complex number 3 + 10i may be input as 3 + 10i or 3 + 10*i in Matlab (make sure not to use i as a variable). In the complex number a + bi, a is called the real part (in Matlab, real(3+5i) = 3) and b is the coefficient of the imaginary part (in Matlab, imag(4-9i) = -9). When a = 0, the number is called a pure imaginary. If b = 0, the number is only the real number a. Thus, complex numbers include all real numbers and all pure imaginary numbers. The conjugate of a complex a + bi is a - bi. In Matlab, conj(2 - 8i) = 2 + 8i. To add (or subtract) two numbers, add (or subtract) the real parts and the imaginary parts separately. For example: (a+bi) + (c-di) = (a+c)+(b-d)i In Matlab, it's very easy to do it: >> a = 3-5i a = 3.0000 - 5.0000i >> b = -9+3i b = -9.0000 + 3.0000i >> a + b ans = -6.0000 - 2.0000i >> a - b ans = 12.0000 - 8.0000i To multiply two numbers, treat them as ordinary binomials and replace i2 by -1. To divide two complex nrs., multiply the numerator and denominator of the fraction by the conjugate of the denominator, replacing again i2 by -1. Don't worry, in Matlab it's still very easy (assuming same a and b as above): >> a*b ans = -12.0000 +54.0000i >> a/b ans = -0.4667 + 0.4000i
Example - Plotting Complex Numbers: % Enter each coordinate (x,y) separated by commas % Each point is marked by a blue circle ('bo') plot(3,2,'bo', -2,5,'bo', -1,-1,'bo') % You can define the limits of the plot [xmin xmax ymin ymax] axis([-3 4 -2 6]) % Add some labels to explain the plot xlabel('x (real axis)') ylabel('y (imaginary axis)') % Activate the grid grid on And you get: 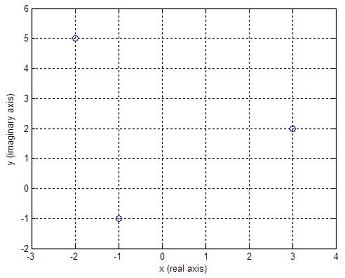 Polar Form of Complex Nrs.In the figure below,  . .Then 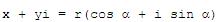 . .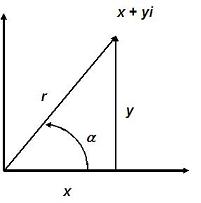 Then x + yi is the rectangular form and 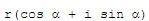 is the polar form
of the
same complex nr. The distance
is the polar form
of the
same complex nr. The distance  is always
positive and is called the absolute
value or modulus
of the complex number. The angle is called the argument or amplitude of the
complex number.
is always
positive and is called the absolute
value or modulus
of the complex number. The angle is called the argument or amplitude of the
complex number.In Matlab, we can effortlessly know the modulus and angle (in radians) of any number, by using the 'abs' and 'angle' instructions. For example: a = 3-4i magnitude = abs(a) ang = angle(a) a = 3.0000 - 4.0000i magnitude = 5 ang = -0.9273 De Moivre's TheoremThe nth power ofis This relation is known as the De Moivre's theorem and is true for any real value of the exponent. If the exponent is 1/n, then  . .It's a good idea if you make up some exercises to test the validity of the theorem. Roots of Complex Numbers in Polar FormIf k is any integer,  . .Then, 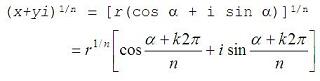 Any number (real or complex) has n distinct nth roots, except zero. To obtain the n nth roots of the complex number x + yi, or , let
k
take on the
successive values 0, 1, 2, ..., n-1
in the above formula.Again, it's a good idea if you create some exercises in Matlab to test the validity of this affirmation. Working with complex or imaginary numbers is easy with Matlab. From 'Complex Numbers' to home From 'Complex Numbers' to 'Matlab Examples'
|