
Periodic function – some codes without special toolboxes in MatlabA periodic
function is a function that
repeats its values in
regular periods or intervals.
Some examples are the trigonometric functions, which repeat their values every 2π radians. Periodic functions are used in math and science in general to describe waves, oscillations or other events that behave the same through periods or cycles along time. A function f(x) is said to be periodic if this is true:  for all values of x. The least positive constant T with this property is called the period. A function with period T will repeat on intervals of length T. These intervals are referred to as periods.
Square waveSquare waves are encountered in switching circuits (digital electronics) and are generated by binary (only two-value) logic devices. They are often used as timing references or ‘clock signals’, because their transitions are appropriate for triggering logic circuits at exactly determined intervals.
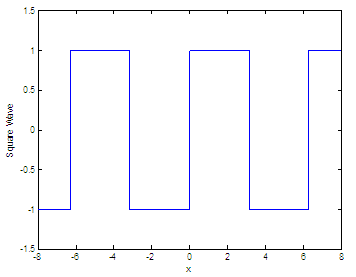
Our first approach for this wave will be a typical scalar function. We can use for-loops to inspect every value (xi) of the input vector. If we detect that xi is in the first half of the period, we’ll set a ‘high’ value; if xi is in the last half of the period, we’ll set a ‘low’ value for the function. Our function generates a
square wave with period 2π for
the elements of time
vector x. Function
sq_w(x) is like
sin(x), only it creates a square wave with peaks of +1 to -1 instead of
a sine
wave. function y =
sq_w(x) We can call our function
like this, from another script (maybe
called ‘test_sq_w.m’) or from the command window: clear,
clc, close all x = -8 :
.01 : 8; The result is:
The second approach is
smarter. We don’t use for-loops and so
the function is called to be vectorized. We use only three lines of
code: function y =
sq_w(x) %
we find elements in the second half of the period by %
we set a -1 only for elements in the second Our third approach is much simpler. We use the standard ‘sin(x)’ function but change all the function’s positive values to 1 and all the negative values to -1.
%
we find positive elements and represent them as 1 %
we find negative elements and represent them as -1 If we
test the function,
the result is the same as before. Sawtooth waveThe sawtooth wave is
another periodic function and a
kind of non-sinusoidal waveform. It
is named a sawtooth due to its resemblance to the teeth on the edge of
a saw. The
common use is that a sawtooth wave goes upward and then sharply drops. An application of the
sawtooth wave is the form of the
vertical and horizontal signals used to generate a trace on CRT-based
televisions or monitor screens. Oscilloscopes also use a sawtooth wave
for
their horizontal deflections. Our sawtooth function has the same phase and period as a sine function. Function
sawtooth_w(x)
generates a sawtooth wave with period 2π for the elements of time vector x. sawtooth_w(x) is like
sin(x), only it
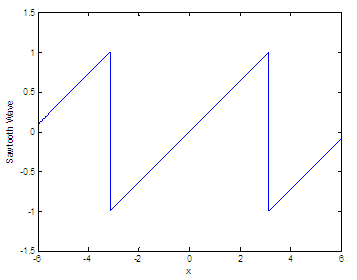
creates a wave with peaks of +1 to -1 instead of a sine wave. Basically, we want y = x (a very informal way to describe it) but reset or repeated every period. We have to take into account that the output value repeats every 2π cycle.
%
and we subtract that corresponding period from
clear,
clc, close all x = -6 :
.01 : 6; and the Matlab resulting plot is:
Impulse
Function Video: tick-labels From
'Periodic Function' to home
From 'Periodic Function' to '2D Plots Menu' |


