

3D Pie ChartsPie charts are circle plots divided into pieces, each piece showing the size of some related portion of information. These charts are used to display the sizes of parts that make up some whole.
You can type ' help pie3 ' on your command window to see the full description and possibilities of this instruction. We show you here two simple 3D-plotting examples. Example 1: Display a vector with a 3D chartWe have some information in a vector 'p'. We want to display the percentage of that information with a 3D chart. The values in the vector are not displayed themselves, only their correspondig percentages.p = [3.3 2.6 .69 .4 .3]; pie3(p) title('Interesting Chart') results in: 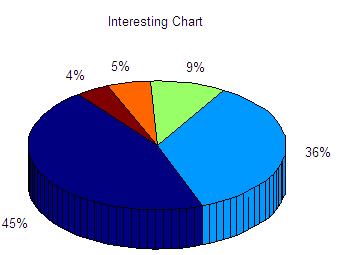 In the expression 'pie3(V, explode, labels)', 'explode' specifies whether to separate a slice from the center of the plot. V(i,j) is apart from the center of the pie plot if explode(i,j) is nonzero. 'explode' must be the same size as V. 'labels' specifies text labels for the slices. The number of labels must equal the number of elements in V. Example 2: add labels to chartsIn this case we have some values in a vector named 'd'. We want to display the 3D pie including neither the values nor the percentages, but an associated label to each portion.d = [1 2 3 2.5]; pie3(d, [1 0 1 0],... {'Label 1', 'Label 2', 'Label 3', 'Label 4'}) title('Pie Chart showing explosions...') results in: 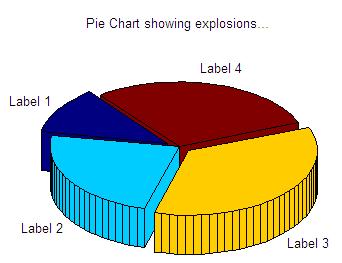 From 'Pie Charts' to home From 'Pie Charts' to '3D plot Menu'
|

