logo for matrixlab-examples.com
[?] Subscribe To This Site

XML RSS
follow us in feedly
Add to My Yahoo!


leftimage for matrixlab-examples.com

RGB images -  an introduction to image processing algorithms

We’ll show some basic ideas on RGB images (or image processing in Matlab). These concepts are fundamental and don’t require any special toolbox.
 
An image in Matlab is a matrix m x n containing colors to be displayed. The colors have to be defined in a color map, which is another matrix. A color map matrix may have any number of rows, but it must have exactly three columns.


Each row is interpreted as a color, with the first element specifying the intensity of red light, the second green, and the third blue (that’s why it’s called an RGB image or matrix).  Color intensity can be specified on the interval 0.0 to 1.0.  


First experiment: define some colors and show them

 
% We can define an arbitrary group of colors to be used
colors1 = [
0 0 0  
% First element = black
0 0 1   % blue
0 1 0   % green
0 1 1   % cyan
1 0 0   % red
1 0 1   % purple
1 1 0   % yellow
1 1 1]; % Last element = white
 

% We prepare the matrix that contains the colors to be displayed
% The list refers to the number of the elements in the color list

w = [1 2 3 4 5 6 7 8];
 

% We use the 'colormap' function to define the actual
% palette in our workspace

colormap(colors1)

% We use the 'image' instruction to display the matrix
image(w)

% We don't want to show values along the axes, for the moment
axis off


This is the image produced

rgb image 1


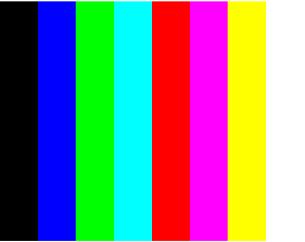
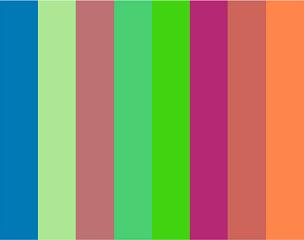
Second experiment: define random colors and display them (5 times)


Press any key (or click the mouse) to change the colors to be visualized...

w = [1 2 3 4 5 6 7 8];
for i = 1 : 5
    colors2 = rand(8,3);
    colormap(colors2)
    image(w)
    axis
off
    disp('Press any key to continue...')
    waitforbuttonpress

end
 

These could be two of the five images. Since they are random colors, you’ll get different results.


rgb image 2 - random colors

 rgb image 3 - another random color


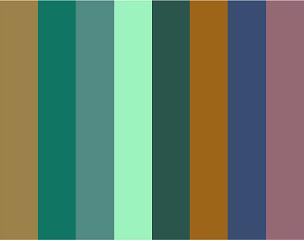
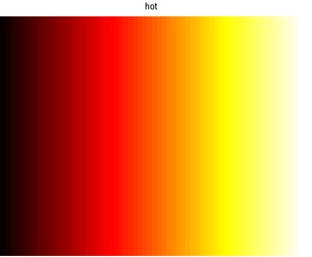
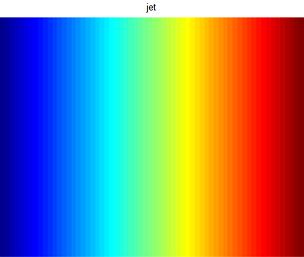
Third experiment: display predefined color palettes 


% There are some color palettes already defined
colors3 = {'hot' 'cool' 'jet' 'hsv' 'flag'};
for i = 1 : 5
   
% We get the predefined palettes (one at a time)
    colormap (colors3{i})
   
% We create the matrix to be shown, with 64 different           % elements
    w = 1 : 64; 
   
% Display the image
    image(w)
   
% Use the names of the different color groups as a title
    title(colors3{i})
    axis
off
    waitforbuttonpress
end


These are two of the palettes:

 color palette named 'hot'


color palette named 'jet'

Now, the interesting part is that we can process images by either modifying the color palette or modifying the appropriate element(s) in the matrix to be displayed.

 
In this example, we change the image by just changing the matrix w

 
colormap hot
w = 1:4:64;
subplot(2, 1, 1); image(w); axis
off

w = fliplr(w);
subplot(2, 1, 2); image(w); axis
off 


This is the graphic result:


simple image process algorithm


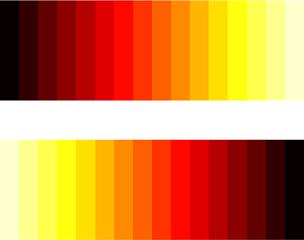
 From 'RGB images' to home

 From 'RGB images' to 'Matlab programming'

 Sitemap
 
Top

Line Detection


footer for matlab page