Scilab
Examples – 2D plots
This
is
a practical approach to plots in Scilab. Several examples are shown to
explore
the capabilities of this software. After each line of code is
explained, we
show the result produced.
Simplest
forms
Function plot2d
plots a set of 2D curves. If you are familiar with the Matlab plot syntax, you
could use function plot. If x and y are vectors, plot2d(x, y,
<opt_args>) plots
vector y versus vector x. x and y vectors must have the same
size.
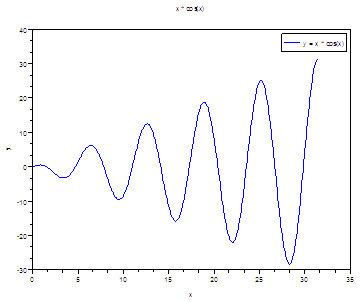
//
Define your x-values
x = 0 :
.1 : 10*%pi;
//
Define your function
y = x
.* cos(x);
// Plot
as used in Matlab
plot(x,
y)
// Add
title, labels and legend
title('x
* cos(x)')
xlabel('x');
ylabel('y');
legend('y
= x * cos(x)');
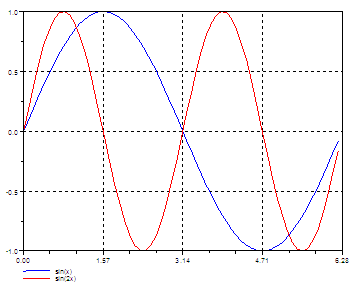
//
Multiple plot with captions and given tics + style
//
Define your x-values
x = [0 :
0.1 : 2*%pi]';
plot2d(x,
[sin(x) sin(2*x)], [2, 5],...
leg =
"sin(x)@sin(2x)", nax = [2, 5, 1, 5],...
rect = [0, -1, 2*%pi, 1])
// [2,
5] means lines in blue (2) and red (5)
// leg =
"sin(x)@sin(2x)" are the legends of the lines
// nax =
[2, 5, 1, 5] are the tics and subtics of the
//
horizontal and
//
vertical axis
// rect
= [0, -1, 2*%pi, 1] are the bounds of the axis,
// from (0, -1) to (2pi, 1).
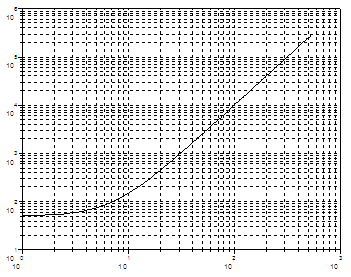
Logarithmic
Axis – Plots
//
Define your variables
t =
linspace(0, 2*%pi, 300);
x =
exp(-t);
y = t;
// Use
the logflag option to define logarithmic or normal axis
// n
for normal, l for logarithmic.
plot2d(x,
y, logflag = "ln");
// Use
xgrid to add a grid on your current figure
xgrid;
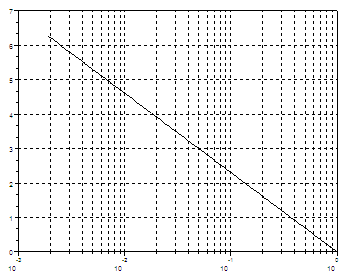
//
Open
a new figure window with scf
scf();
plot2d(t, exp(t), logflag = "nl"); xgrid;
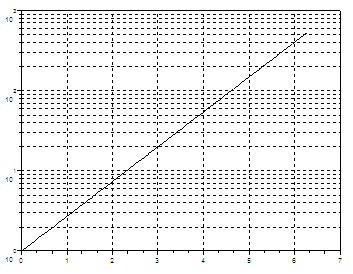
// Both axis are logarithmic now
scf(); plot2d(exp(t), 50 + exp(2*t), logflag =
"ll") ; xgrid
Polar Plots
polarplot
- Plot polar coordinates
polarplot(theta,
rho, <opt_args>)
//
Define your variable
t =
linspace(0, 2*%pi, 100);
//
Define your polar function
r =
sqrt(abs(2 * cos(5*t)));
// Plot
in polar coordinates
polarplot(t,
r);
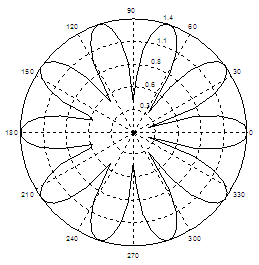
Polar Plots in Matlab
Histograms in Scilab
histplot - plot a
histogram
histplot(bins, data, <opt_args>)
// Define your data or get it somehow
y = 10 * rand(500, 1);
// Create the histogram. The 5 at the beginning means 5
bins.
// The 2 at the end means lines in blue.
histplot(5, y, 2)
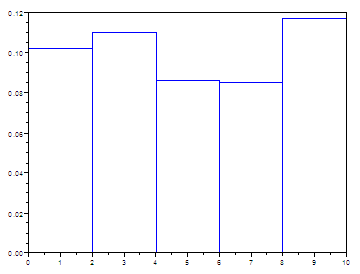
Histograms in Matlab
Pie Plots
pie - draw a pie
pie(x [, sp [,txt]])
x is a scalar or a vector
of real, positive numbers.
sp is a real scalar or vector.
txt means a cell or a vector of strings.
pie([1 3 4 5], [1 0 1 0],...
["Part1
Exp.","Part2","Part3 Exp.", "P4"]);
// [1 3
4 5] is the number and size of sectors
// [1 0
1 0], 1 for exploded sector, 0 for nonexploded
//
["Part1 Exp.","Part2","Part3
Exp.", "P4"] is the associated
// text

Pie Plots in Matlab
Stems – Vertical lines
plot2d3 - 2D plot
(vertical bars)
plot2d3([logflags,] x,y,[style,strf,leg,rect,nax])
plot2d3(x,y <,opt_args>)
plot2d3 is the same as
plot2d but curves are plotted using
vertical bars. By default, successive plots are superposed. To
clear the
previous plot, use clf().
// Define your independent
values
x = [0 :
0.2 : 4*%pi];
//
Define your functions and plot.
// The
default color is black
plot2d3(x,
sin(x))
// 5 at
the end means red line
plot2d3(x,
sin(2*x), 5)
//
Superimpose a red envelope on the red lines
plot2d(x,
sin(2*x), 5)
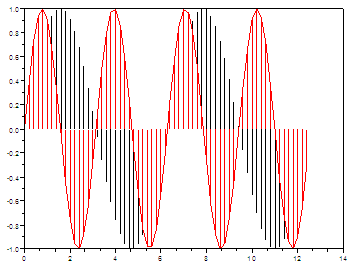
Stems in Matlab
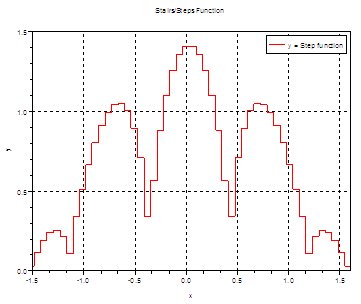
Stairs Function
Use plot2d2 for this purpose.
// Define your variables and functions
t = linspace(-2*%pi, 2*%pi, 200);
r = sqrt( abs(2 * cos(4*t)) );
y = r .* cos(t);
// Plot using a red line (5) and
// bound axis from (-1.5, 0) to (1.6, 1.5)
plot2d2(t, y, 5, rect = [-1.5, 0, 1.6, 1.5]);
// Add title, labels, legend and grid
title('Stairs/Steps Function');
xlabel('x'); ylabel('y');
legend('y = Step function');
xgrid;
From
'Scilab Examples' to Matlab home
From
'Scilab Examples' to Scilab Menu

|
|

